아래 내용은 [Topological Data Analysis and Its Application to Time-Series Data Analysis] 논문의 내용을 요약한 글이다
Introduction
전통적인 시계열 분석 방식인 주파수 분석이나 평균, 분산과 같은 통계를 변동성이 높은 센서 데이터셋에 사용하면 충분한 성능을 보이지 못하는 경우가 많다 (데이터가 정규분포를 따르지 않고, 분포가 분극화된 경우가 많다)
따라서, 일반적인 기술통계량(분산 등)을 가지지 않는 경우가 많은 센서 데이터셋 분석에 적합한 기법이 없어 TDA를 고안
topological data analysis (TDA)란?
데이터 형상에 주목
capture detailed information by focusing on the shape of shape without using statistical techinques
TDA의 2가지 주요 기술 :Mapper, persistent homology
Mapper
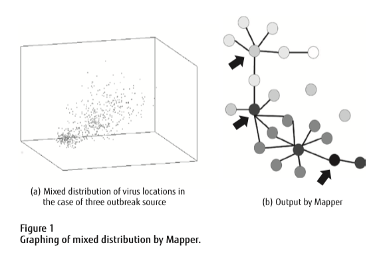
Mapper is a technology that presents the distinguishing features of a set of data as an easy-to- understand graph. To grasp such data features, Mapper groups important parts of that data as nodes and connects nodes having contiguous data by lines (edges), thereby converting that dataset to a graph. Mapper can visualize the distribution of the data by outputting the dataset as a 2D graph.
Mapper constructs a graph by using data concentration as a basis to group important locations where the concentration is either higher or lower than the periphery into nodes (highly concentrated nodes are shown in dark colors)
Mapper can capture features that are lost in big data and difficult to extract. Because of this capability, it is starting to be applied overseas for a variety of purposes such as anti-money-laundering measures in the field of finance and discovery of associations between disparate diseases in the field of healthcare.
Persistent homology
In contrast to Mapper that can visually grasp the important elements of a certain set of data, persistent homology is a technology that can numerically capture a data shape in detail. It is important in data analysis to understand the arrangement of data, but there are cases in which conventional statistical quantities such as mean and variance cannot convey that feature.
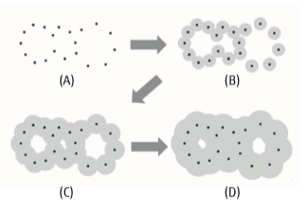
1) Persistent homology considers circles (or spheres in the cases of 3D data) centered about each point of data.
2) When each of these circles expands, the figure can take on a new shape as neighboring circles join up with each other.
3) At this time, the distinguishing characteristics of the data can be understood by observing the change in the number of holes included in the figure.
As machine learning commonly uses input data that are composed of equal-length vectors, persistent homology vectorizes the points of data as “Betti sequences.”
모델링 방식
1) Attractor conversion
불변지배방정식 (invariant governing equations)은 시계열 데이터에서 변동성을 표현하는 미분 방정식이며, 만약, 2가지 시계열 데이터가 같은 상태라면, 지배방정식은 같다.
지배방정식으로 figure로 변환하기 위해 attractor를 사용한다. An attractor is a set of solutions to differen- tial equations, so “equation analysis” and “attractor analysis” are synonymous. In addition, considering that time-series data has a finite length in practice, an actual attractor would be a finite set of points.
2) Vectorization by persistent homology
attractor를 활용해 point의 집합으로 데이터를 변환한 것을 point arrangement를 유지하면서 머신러닝에 적합한 벡터 형식으로 변환해주기 위해 persistent homology를 사용한다. 이때 생성된 벡터는 Betti sequence라고 불린다
3) 1D-CNN을 활용한 supervised learning
같은 지배 방정식을 가진 시계열 데이터라도 동일한 벡터 요소로 표현되는 것이 아니라 인접한 요소로 표현된다. 이는 이미지 인식 분유에서 물체의 위치가 이동되는 것과 유사하다. Given a Betti sequence created from an attractor using persistent homology, a feature component often appears in an adjacent vector element even for time- series data having the same governing equations.
CNN은 물체 인식 분야에서 높은 성능을 보이기 때문에, Betti sequence 분석에 있어서도 유사할 것이라 기대하며 본 논문에서는 CNN을 활용했다. 이미지는 2D인 반면, Betti sequence는 1D 벡터이고 다중의 데이터를 합쳐 사용해야할 수도 있기 때문에 1D CNN을 병합한 모델을 생성했다.
이를 전통적인 머신러닝 모델인 SVM과 비교해 결과를 도출했음
anomaly detection 분야에서의 적용
1) This technology obtains data from time-series data in fixed periods, converts each set of data to a Betti sequence (지정된 기간에 수집된 데이터 window마다 변환해 비교)
2) compares the results with reference data. (data obtained beforehand in a normal state is used, and in the case of change detection, immediately previous data is used as reference data)
3) algorithm calculates the difference between the target data and reference data as a detection criterion and treats the time at which the difference becomes large as the detection time point.
multiple methods for calculating the difference between refer- ence and obtained data, including methods based on deep learning. (This makes it possible to observe the changes of rules in time-series data generation in the source )
일본의 경우, 다리가 노후되어 이를 적절하게 유지보수하기 위해 사전에 다리의 노후화 상태를 감지하는 anomaly detection 모델이 필요했기에, 해당 논문에서는 TDA와 딥러닝을 통해 이 문제를 해결하려했다
Reference

